

PROPERTY MARKET TRENDS 3Q 2025
PROPERTY MARKET TRENDS
3Q 2025
Residential: Prices rose in rental apartments, as demand outpaced supply
Offices: Favorable rent increases even in major regional city markets
Hospitality: Occupancy rates remained at the 70% level at both limited-service hotels and full-service urban hotels
Residential
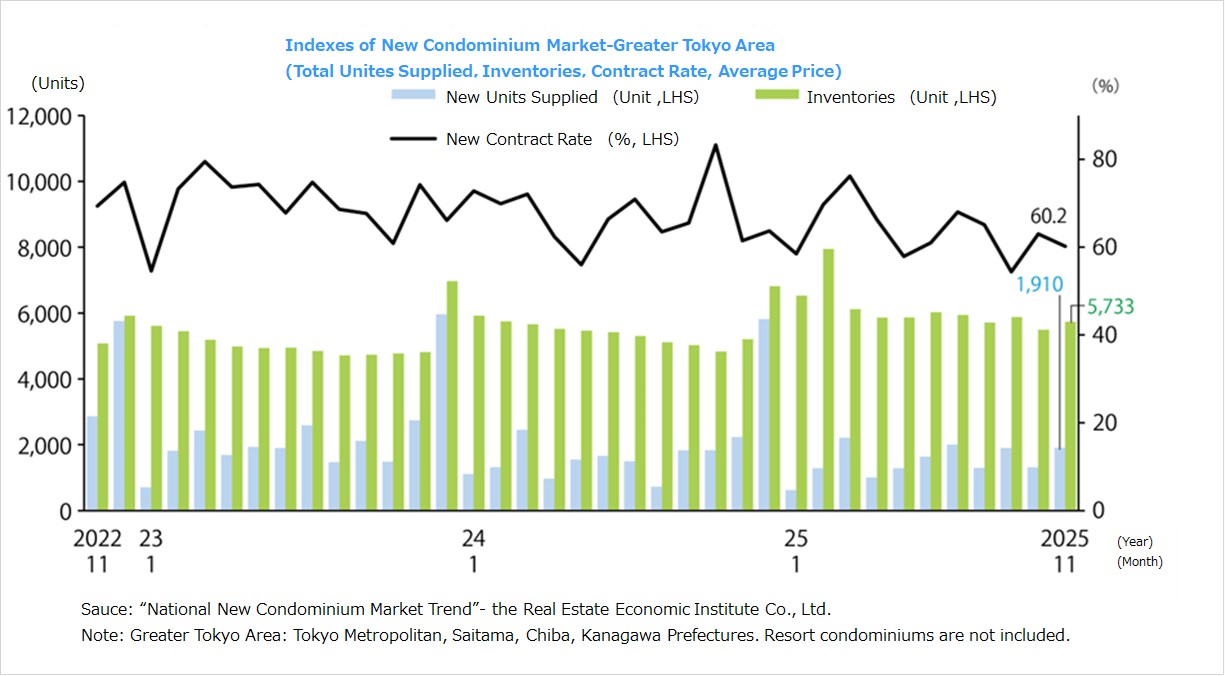
Even as prices continued to increase in both the Tokyo metropolitan area and the Kinki region, the contract rate was low in the Tokyo metropolitan area, where the supply of units fell sharply, and maintained a level of approx. 70% in the Kinki region.
■ New condo. sales in Tokyo metropolitan area
・In January 2026, there was a new supply of 628 units (up 1.3% YoY), and the average initial sales price, floor area, and unit price were JPY 83.83 million (up 14.2% YoY), 67.09 sqm (up 2.0% YoY), and JPY 4.123 million per tsubo (up 11.9% YoY), respectively. The month-end inventory was 6,627 units, while the contract rate in the first month of sales was 55.7%, down 2.8 ppt YoY.
・There was a new supply by area of 175 units in the 23 wards of Tokyo, and the average initial sales price and unit price were JPY 121.26 million (up 15.8% YoY) and JPY 6.277 million per tsubo (up 7.5% YoY), respectively. The share of the supply was 27.9%, and the contract rate in the first month of sales was 54.3%, up 0.2 ppt YoY.
■New condo. sales in Kinki region
・In January 2026, there was a new supply of 1,074 units (up 39.7% YoY), and the average initial sales price, floor area, and unit price were JPY 45.88 million (up 13.8% YoY), 45.93 sqm (down 0.3% YoY), and JPY 3.296 million per tsubo (up 14.2% YoY), respectively. The month-end inventory was 3,432 units, while the contract rate in the first month of sales was 72.3%, down 7.5 ppt YoY. Prices increased YoY for the second consecutive month, while the unit price rose for the fourth consecutive month.
■Second-hand condo. sales in Tokyo metropolitan area
・The number of contracts made in December 2025 was up 25.9% YoY to 3,975 units, rising for the 14th consecutive month, while the unit price per tsubo rose for the 68th consecutive month, reaching JPY 2.808 million (up 9.0% YoY). The contract price rose for the 14th consecutive month to JPY 53.40 million (up 8.2% YoY). Exclusive floor area was down 0.7% YoY to 62.77 sqm, while the inventory fell for the 5th consecutive month, to 43,381 properties (down 3.6% YoY).
・The number of units newly listed increased for the first time in six months to 14,601 units (up 2.0% YoY), and the initial sales price increased by 33.0% YoY to JPY 59.47 million.
■Rental apartments in Tokyo metropolitan area
・The number of contracts made for rental apartments in October–December 2025 was 32,031 units (up 3.3% from July–September 2025 in the previous period), and the 23 wards had a share of 61.5%. ・While residents are increasingly choosing rental apartments because of rising condo prices, rising market rents appear to be contributing to a stronger flow of tenants from the 23 wards of Tokyo to lower-rent areas. While in many cases the product level (floor space) has decreased from January–March 2025, a trend toward a review of residential areas appears to be proceeding at present.
■Market overview
・The new condo supply in 2025 was 59,940 units nationwide. Of these, 21,962 units (for a 36.6% share) were in the Tokyo metropolitan area and 16,922 (28.2%) in the Kinki region. Since supply stood at 76,993 units nationwide—35,772 (46.4%) in the Tokyo metropolitan area and 18,676 (24.3%) in the Kinki region—in 2016, it has decreased by 13,810 units in the Tokyo metropolitan area and 1,754 units in the Kinki region since then.
・From 2016 to 2025, prices rose 1.67 times from JPY 54.90 million to JPY 91.82 million in the Tokyo metropolitan area and 1.36 times from JPY 39.19 million to JPY 53.28 million in the Kinki region.
Office
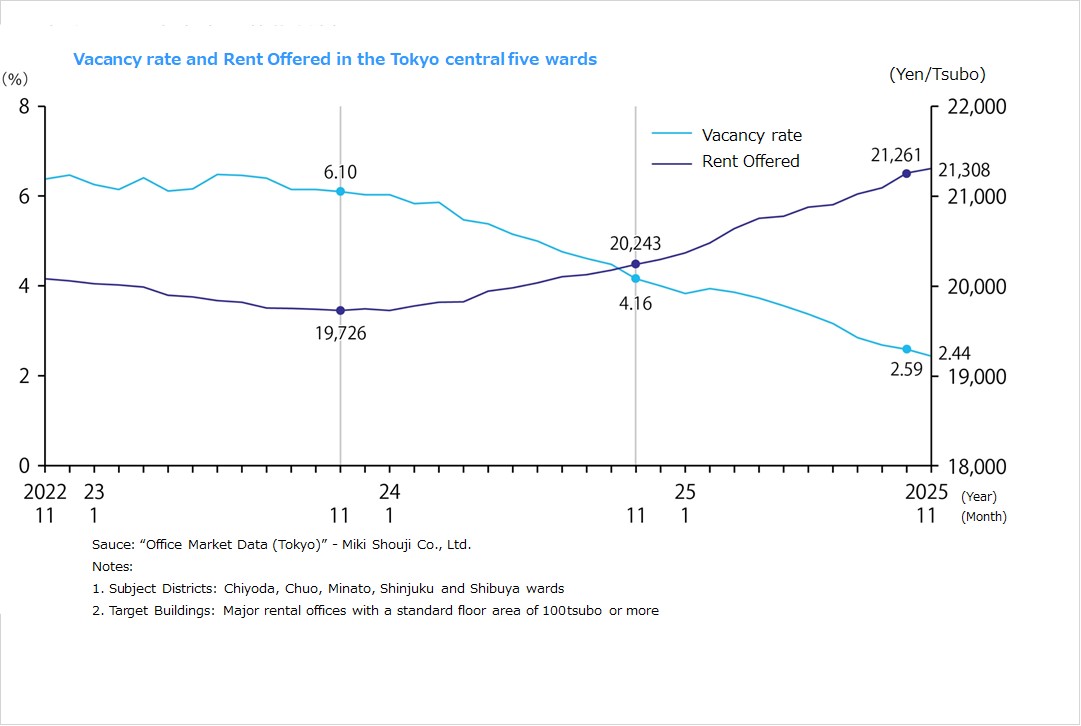
There were pronounced trends toward improved vacancy rates and higher rents in the Tokyo metropolitan area market as vacancy rates remained at the 1% level in the Chiyoda and Shibuya Wards.
■Large-scale office buildings in Tokyo CBD (Central 5 Wards)
・The average vacancy rate in January 2026 was 2.15% (down 0.07 ppt MoM). The rate has remained below the 3% level since August 2025 as the market shows a steady trend.
・JPY 21,648/tsubo, average rent was up JPY +239 MoM and JPY +1,280 YoY, continuing to increase since February 2024.
・Vacant floor space decreased by about 5,300 tsubo in one month. While some buildings were completed with vacancies remaining and some vacancies appeared as new buildings began seeking tenants, the trend on concluding contracts was steady because of factors that included additional floors and space expansions in currently occupied buildings and the opening of new offices.
・Vacancy rates fell MoM in the Chiyoda, Chuo, and Shibuya Wards with rates in the Chiyoda and Shibuya Wards both below 2%. Average rent was up MoM in all five central wards.
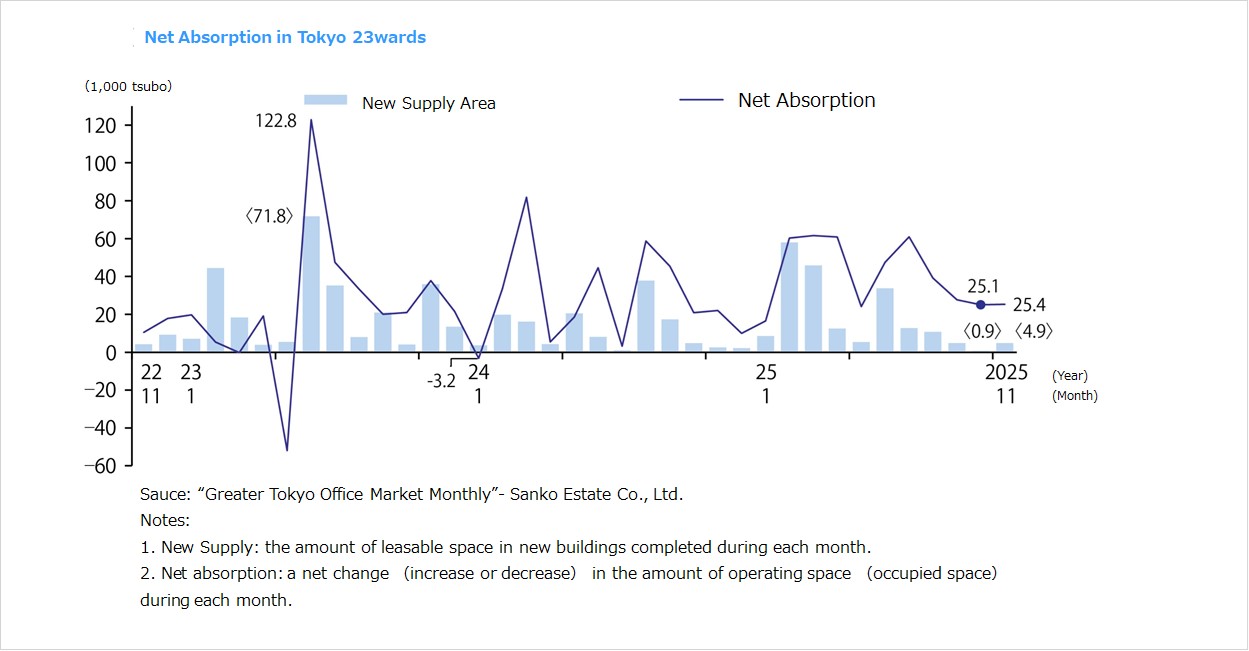
■Net absorption
・Net absorption (change in office occupied floor space) was +24,384 tsubo in January 2026, up 7,828 tsubo YoY, in the 23 wards of Tokyo. Cumulative annual total net absorption was 470,834 tsubo, and cumulative annual total new supply was 208,709 tsubo in 2025.
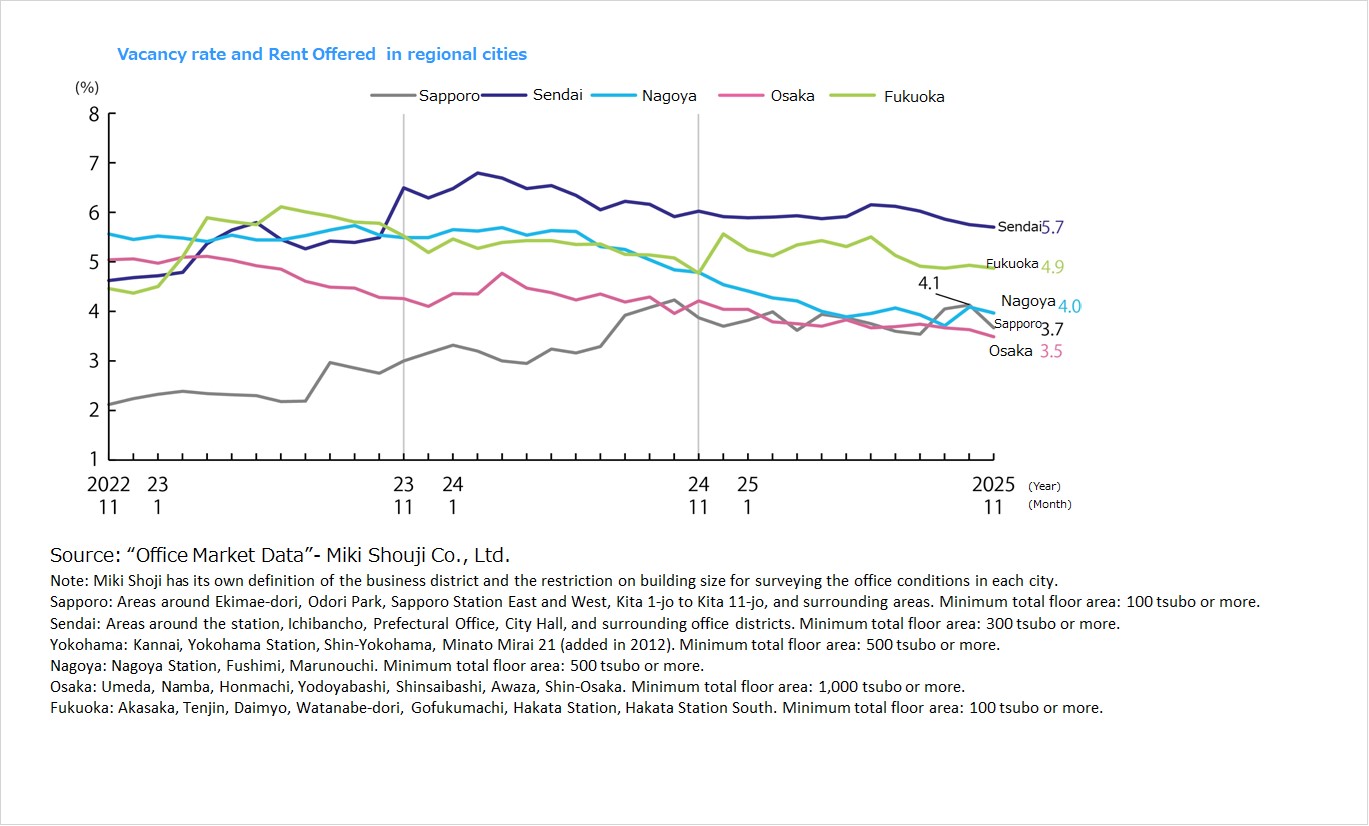
■Vacancy rates, and average rents in major regional cities / August 2025
・Sapporo: Vacancy @ 3.50% down 0.08 ppt MoM. Average rent @ JPY 11,078 per tsubo up JPY +28 MoM. (Vacancy rate changed little, while average rent increased.)
・Sendai: Vacancy @ 5.54% down 0.02 ppt MoM. Average rent @ JPY 9,578 per tsubo up JPY +29 MoM. (Vacancy rate changed little, while average rent increased.)
・Yokohama: Vacancy @ 6.58% down 0.43 ppt MoM. Average rent @ JPY 13,218 per tsubo up JPY +19 MoM. (Vacancy rate improved, while average rent increased)
・Nagoya: Vacancy @ 3.83% up 0.12 ppt MoM. Average rent @ JPY 12,901 per tsubo up JPY +29 MoM. (Vacancy rate worsened slightly, while average rent increased.)
・Osaka: Vacancy @ 3.47% down 0.37 ppt MoM. Average rent @ JPY 12,821 per tsubo up JPY +71 MoM. (Vacancy rate improved, while average rent increased)
・Fukuoka: Vacancy @ 5.12% up 0.17 ppt MoM. Average rent @ JPY 12,318 per tsubo up JPY +37 MoM. (Vacancy rate worsened, while average rent increased.)
The vacancy rate took a favorable turn in all areas other than Nagoya and Osaka, while rents showed increases in all areas and favorable trends continue.
■Status quo and future market outlook
・According to Mori Building's 2025 survey of office needs in the 23 wards of Tokyo (which surveyed about 10,000 of the largest companies in terms of capital in September 2025), 27% of respondents reported having plans to lease new office space in the future. A percentage of 60% of respondents reported increases in new office space they planned to lease. The percentage answering that the most recent rent revision had increased rent rose to 89%. Furthermore, a high percentage of 54% of respondents saw expenditures on the office environment as investments to secure human resources and ensure company survival. This is one factor supporting the strong demand for new large office buildings with high unit prices.
・Supply in the main business areas (3.42 million sqm) is projected to account for 75% of cumulative total supply in the 23 wards of Tokyo over the five-year period 2025-2029 (4.59 million sqm) as the progressive concentration of offices in central Tokyo appears likely to continue. While increases in supply are particularly pronounced in the Nihonbashi/Yaesu/Kyobashi, Shinagawa, and Akasaka/Roppongi areas, where large-scale development is underway, there is a possibility that this could lead to an increase in numbers of areas facing difficulties securing tenants outside of the central office districts. Annual supply is projected to be 900,000 sqm in 2026, 450,000 sqm in 2027, 650,000 sqm in 2028, and 1.27 million sqm in 2029.
Hospitality
The total number of overnight stays, including domestic demand, remains around 50 million, as increasing numbers of tourists, chiefly from Europe and North America, are seeking experiences in Japan.
■Continued growth in inbound guests from markets other than China
・In December 2025, the total number of overnight stays in Japan was 53.59 million (down 4.2% YoY). A breakdown shows 38.12 million overnight stays by Japanese guests and 15.47 million by inbound guests. The number decreased from 58.61 million overnight stays in October to 55.99 million in November. Although the numbers of inbound guests have been decreasing since November when the Chinese government asked its citizens to refrain from traveling to Japan, the decrease has been limited as the numbers of visitors from other countries increase.
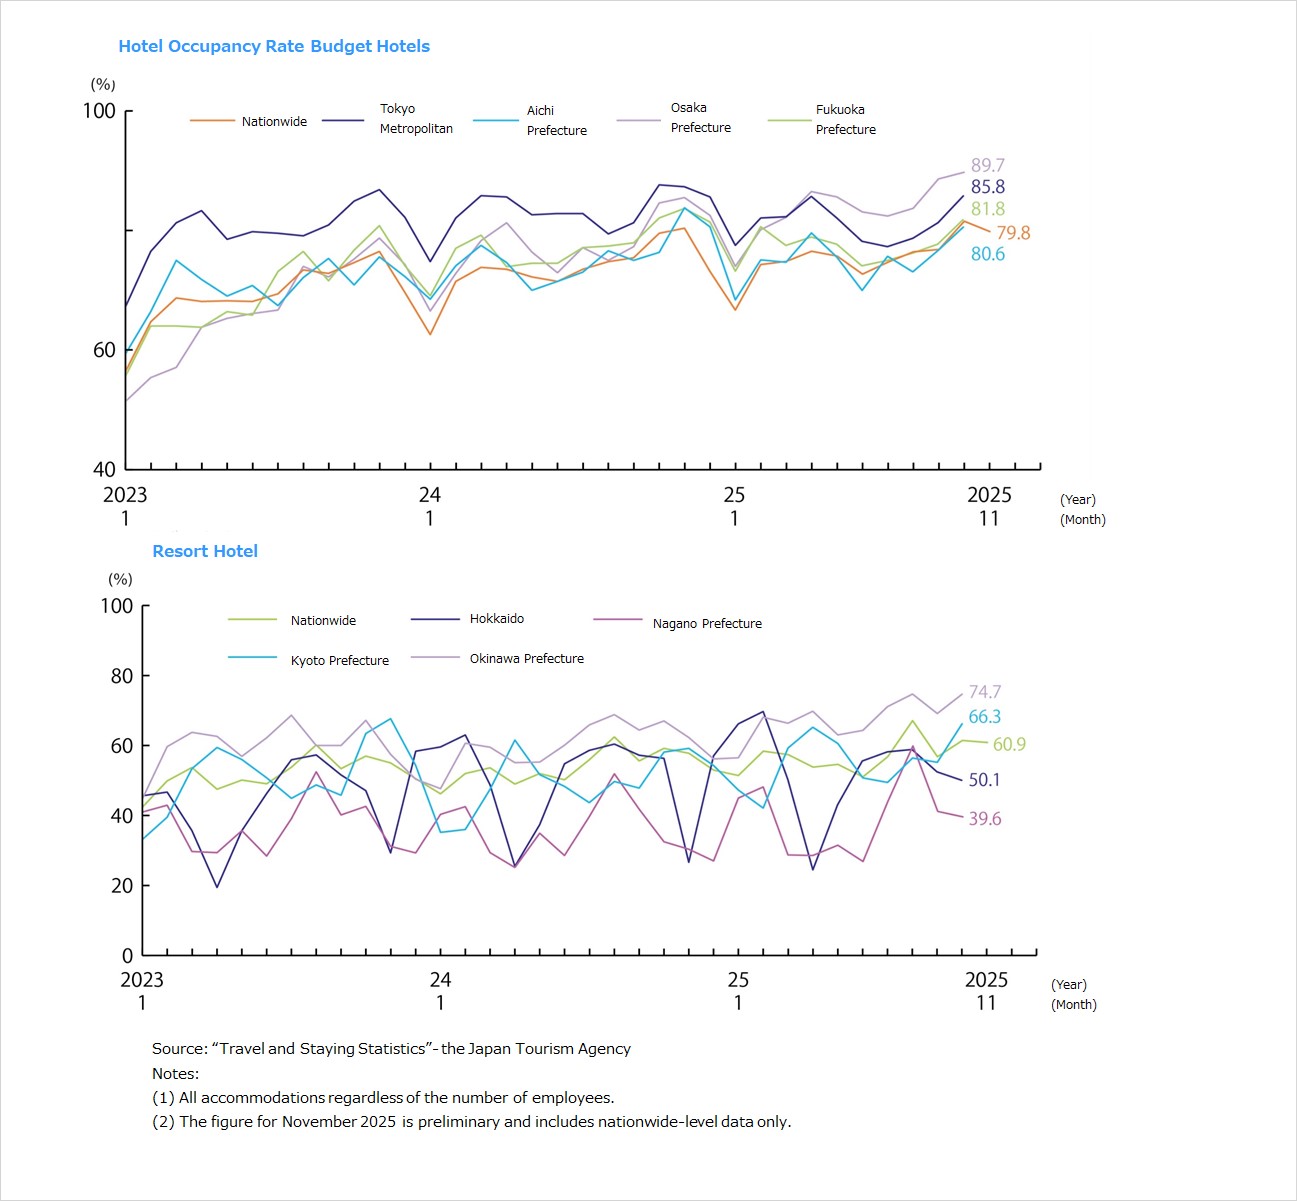
■Recent trends by category
・Numbers of guests by type of accommodation were 25.630 million (47.8% share) for limited-service hotels, 8.959 million (16.7%) for full-service urban hotels, and 6.342 million (11.8%) for resort hotels, with numbers increasing for full-service urban and resort hotels due to seasonal factors associated with the month of December.
・Guestroom utilization rates (at facilities with 10 or more employees) in December 2025 were 35.3% for Japanese-style inns, 53.7% for resort hotels, 73.6% for limited-service hotels, and 73.0% for full-service urban hotels. Rates were highest for limited-service hotels and full-service urban hotels. The guestroom utilization rate for limited-service hotels exceeded 80% in three districts: Saitama, Tokyo, and Kanagawa Prefectures, while the rate was 77.2% in Kyoto Prefecture.
■Inbound trends
・The number of inbound visitors to Japan in December 2025 was 3.617 million (up 3.7% YoY), a record high for December. As travel demand increased with school holidays and the Christmas and New Year's season, the numbers of visitors increased markedly from Korea and Taiwan in East Asia, from Malaysia and Thailand in Southeast Asia, and from the US and Canada in Europe, North America, and Australia. The top five countries in terms of total numbers of overnight stays in Japan were Korea with 1.900 million nights, Taiwan with 1.873 million, China with 1.556 million, the US with 1.323 million, and Singapore with 881,000. ・The annual number of inbound visitors to Japan in 2025 was 42.683 million (up 15.8% YoY), increasing by 5.8 million or more from 2024 to a new record high.
■Status quo and future market outlook
・A survey of inbound consumption trends shows consumption of JPY 2.533 trillion by visitors from abroad in 4Q 2025 (October–December) (up 10.3% YoY). A breakdown by nationality and region shows consumption of JPY 353.4 billion by travelers from China (down 17.9% YoY), JPY 326.5 from the US (up 22.1%), JPY 306.7 billion from Taiwan (up 4.7%), JPY 271.7 billion from Korea (up 4.1%), and JPY 159.7 billion from Hong Kong (down 2.3%), indicating the impact of China’s restrictions on travelling to Japan. ・The numbers of travelers are increasing from most countries as tourists focus on such factors as traditional arts, natural beauty, and public safety, and a market appears to be growing that is independent of group travelers from China in the hospitality industry. The trend toward traveling in pursuit of experience also appears to be expanding, and numerous regions are introducing new measures targeting this trend. There appears to be an increase in inbound guests seeking to enjoy a Japanese experience instead of sightseeing alone based in hotels in each region.
Commercial
Existing store sales for shopping centers (overall) were more than JPY 874.8 billion (up 1.8% YoY) in December 2025, as development of urban shopping centers is expected to increase with redevelopment of central urban department stores and other sites.
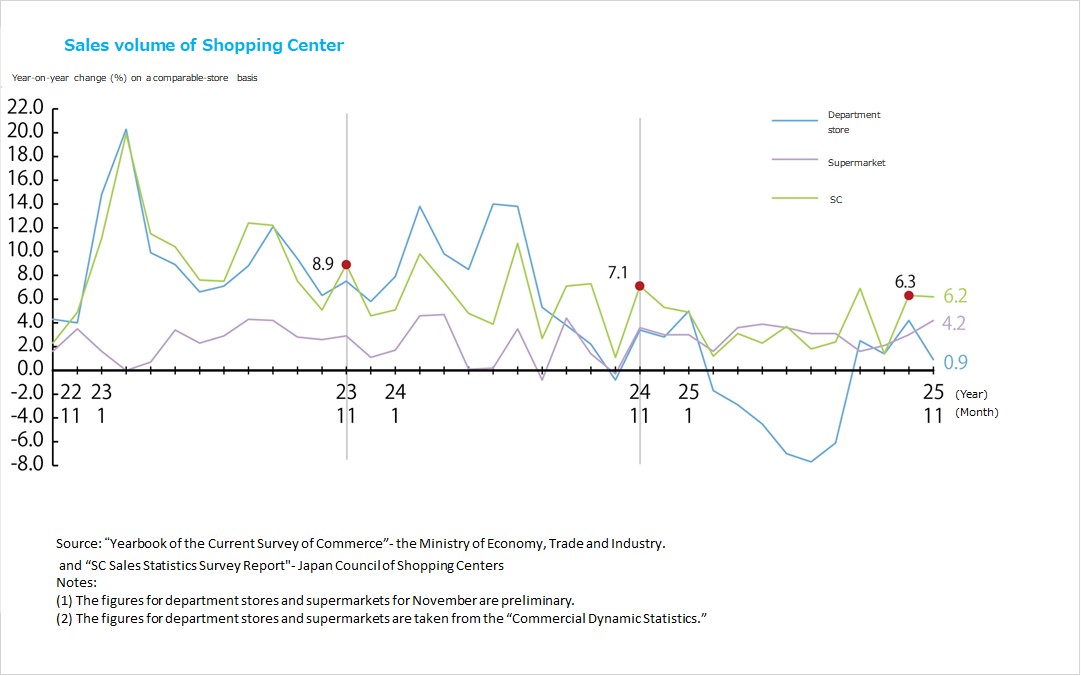
■Sales volume of shopping centers
・Existing store sales for shopping centers (overall) were JPY 874.85 billion in December 2025, up 1.8% YoY. Viewed by segment, conditions were challenging for sales of outerwear and other heavy apparel and winter apparel in the fashion market, while sales of character merchandise as well as seasonal gifts and New Year's demand were strong among sundries, and the demand for souvenirs as well as seasonal Christmas and New Year's demand drove favorable food sales. The trend was favorable for food and beverage services overall, powered by such uses as year-end parties, and the demand for cinemas and relaxation services was also strong.
・According to the Japan Department Store Association, department store sales in December 2025 were down YoY (by 1.1%) for the first time in five months, falling to just above JPY 654.2 billion. Inbound sales were down 17.1%, and inbound customers were down 16.7% YoY as a pronounced decrease in inbound demand resulted in the second consecutive month of decreases in both of these figures. The domestic market was favorable with domestic sales up 0.6% YoY. Sales growth was positive for the fifth consecutive month.
■Status quo
・One prominent trend in 2025–2026 was that toward the opening of redeveloped retail facilities in Takanawa Gateway, Yaesu, Nagoya Sakae, and other areas. While the number of large shopping centers opening in central urban areas increased with redevelopment, conditions remain challenging for department stores, and the movement toward closure of long-established department stores or converting them to shopping centers appears likely to accelerate in Osaka, Nagoya, and Yokohama. There are expectations for redevelopment from department stores, which have weaknesses in parking due to their locations on prime real estate, to shopping centers reflecting consideration for parking capacity.
・As the trend among inbound tourists shifts toward the consumption of experiences, retail facilities across Japan are moving to enhance their experiential tenants. There is an increasing trend in retail facilities centered on cinemas, saunas, and amusement facilities as retail facilities become leisure spots instead of just places to shop, even among Japanese consumers.
Logistics
In 2026, demand and supply are expected to remain in balance in the Tokyo metropolitan area and the Chubu region, while the increase in vacancy rates slows in the Kinki and Fukuoka regions as new supply levels off.
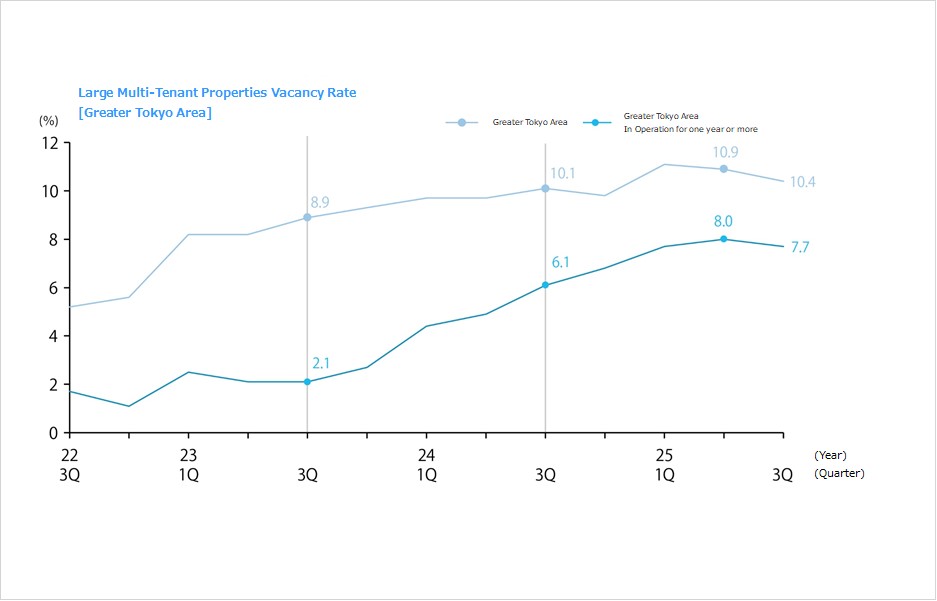
■Market conditions in the Tokyo metropolitan area and conditions by area in 4Q 2025
・The vacancy rate for large multi-tenant logistics centers (LMTs) in 4Q 2025 was 9.8% (down 0.6 ppt QoQ). While the occupancy rate on completion of the 46,000 tsubo in new supply in three buildings in this quarter was low at approximately 20%, new demand was 86,000 tsubo, reflecting major contracts concluded on existing properties and other factors.
・New supply in 2026 is projected to be 524,000 tsubo, below the average for the past 10 years, and there are numerous existing vacant warehouses. As a result, the vacancy rate is expected to remain flat or fall only slightly. Effective rent was JPY 4,490 per tsubo in the Tokyo metropolitan area overall, up 0.2% QoQ. ・The vacancy rate and rent in each area are as follows. Tokyo Bay area: 4.0% (down 1.0 ppt QoQ), JPY 7,730 per tsubo (up 0.5%). Vacancies are being filled in existing properties as there was no new supply during the period. Tokyo Gaikan Expressway area: 4.4% (down 1.0 ppt QoQ), JPY 5,370 per tsubo (up 0.6%). One new property was completed in Saitama Prefecture with full occupancy. Vacancies are being filled in existing properties amid booming demand. New supply of five properties is planned for 2026, and while the vacancy rate should rise temporarily, the balance between supply and demand appears to be stable. National Route 16 area: 9.6% (up 0.3 ppt), JPY 4,550 per tsubo (flat). Even as two new facilities were completed with vacancies remaining in Saitama and Kanagawa Prefectures, the number of properties with vacancies is decreasing, and vacancies are being filled across the areas, including inland. Metropolitan Intercity Expressway area: 15.0% (down 2.0 ppt), JPY 3,480 per tsubo (flat). Vacancies are being filled in existing properties as there was no new supply during the period and Ibaraki, Chiba, and Saitama Prefectures experience demand centered on food products and home furnishings.
■Market conditions in other regions in 4Q 2025
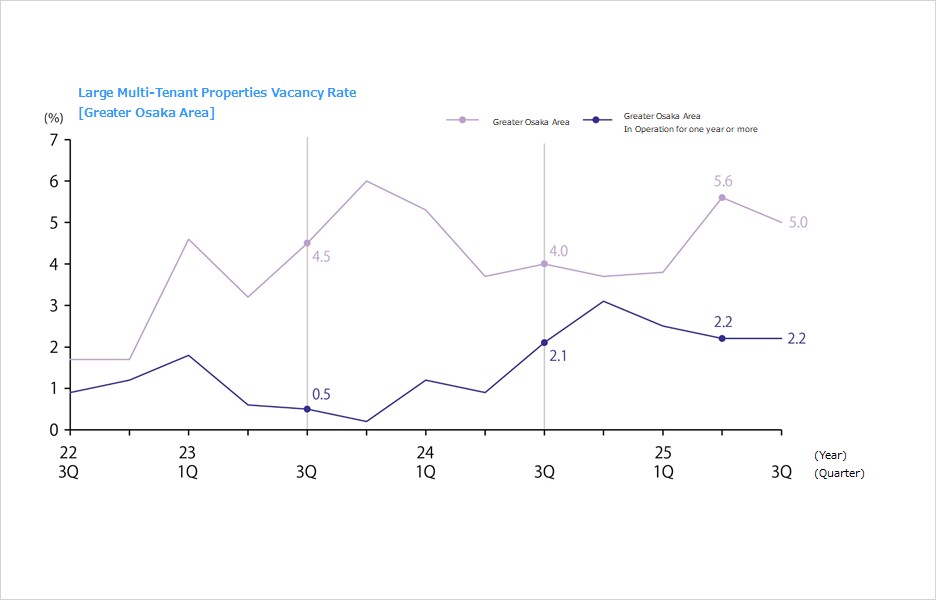
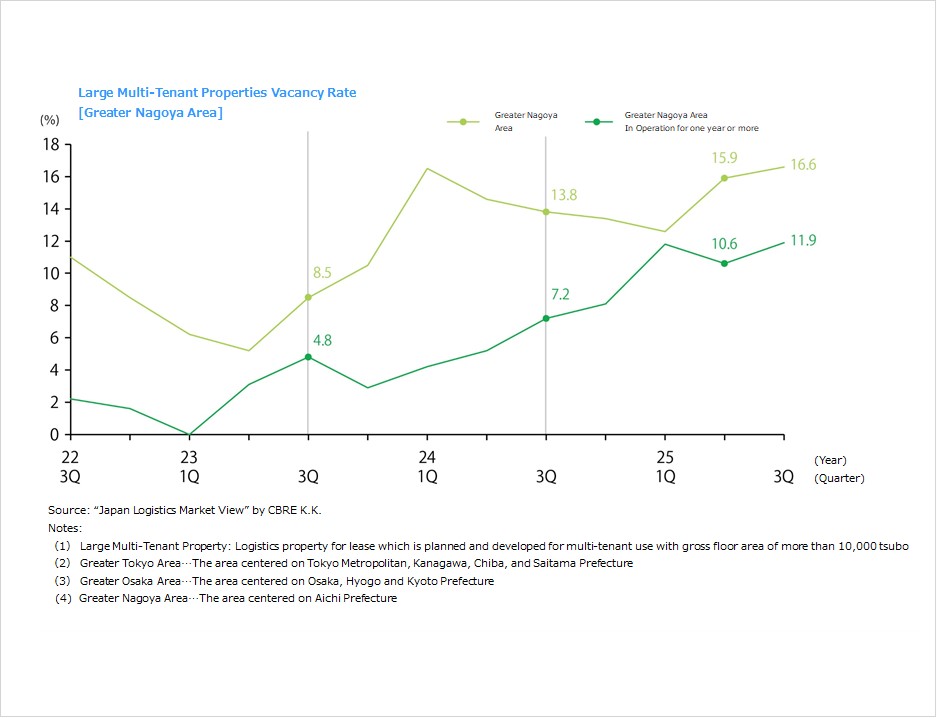
・Vacancy rates and rents in other areas are as follows. Kinki region: 4.2% (down 0.8 ppt YoY), JPY 4,290 per tsubo (up 0.7%). One new facility, a large one with more than 70,000 tsubo in space, was completed with full occupancy. New demand of 79,000 tsubo exceeded the quarterly average over the past five years, and new demand totaled 375,000 tsubo over the full year of 2025. Demand is growing as logistics firms, e-commerce firms, and other tenants in such segments as food products and apparel aggressively expand distribution facilities. New supply in 2026 is forecast to be 167,000 tsubo, only about 40% of the 2025 level, and the vacancy rate is expected to fall to the 3% level. Chubu region: 15.5% (down 1.1 ppt), JPY 3,730 per tsubo (up 0.3%). All three new properties were completed with tenants. Vacancies are being filled in existing properties, too. New demand was high this period at 83,000 tsubo. New demand in the full year of 2025 was 148,000 tsubo, the second highest level ever. New supply in 2026 is forecast to be somewhat low at just under 40,000 tsubo in four properties. Fukuoka region: 5.6% (down 2.7 ppt), JPY 3,570 per tsubo (flat). The lack of new supply and a contract concluded on a large portion of a property completed in 3Q drove the vacancy rate down. Effective annual rent in 2025 was up 0.8% in the Fukuoka region as a whole, and new supply of 99,000 tsubo in eight properties is forecast for 2026, a record high. .
■Future market outlook
・New supply of space projected in 2026 is 524,000 tsubo in the Tokyo metropolitan area, 167,000 tsubo in the Kinki region, just under 40,000 tsubo in the Chubu region, and approximately 100,000 tsubo in the Fukuoka region. New supply is expected to be down from 2025 in all regions except for Fukuoka.
・In the Tokyo metropolitan area, recent trends are projected to continue of more demand than supply in the Tokyo Bay area and a healthy balance between demand and supply despite the new supply in the Tokyo Gaikan Expressway area. In the National Route 16 area, while supply is shrinking as vacancies are filled, a healthy balance between demand and supply is expected to continue.
・Demand is projected to exceed supply in the Kinki region, where new supply in 2026 will be only about 40% of the 2025 level. This market is attracting attention since its rents are increasing, too.
・Since new demand in the Chubu region in 2025 reached its second highest level ever, the balance between supply and demand is not expected to collapse even as supply is scarce in 2026.
・New supply in the Fukuoka region, where vacancy rates are in an increasing trend in 2026, is expected to reach a record high level, and supply is expected to continue to exceed demand.
J-Reit
Backed by the recovery in investment unit market prices, POs resumed for the first time in five months, and existing issues can be expected to increase capital efficiency and investment unit prices.
■J-Reit market trend
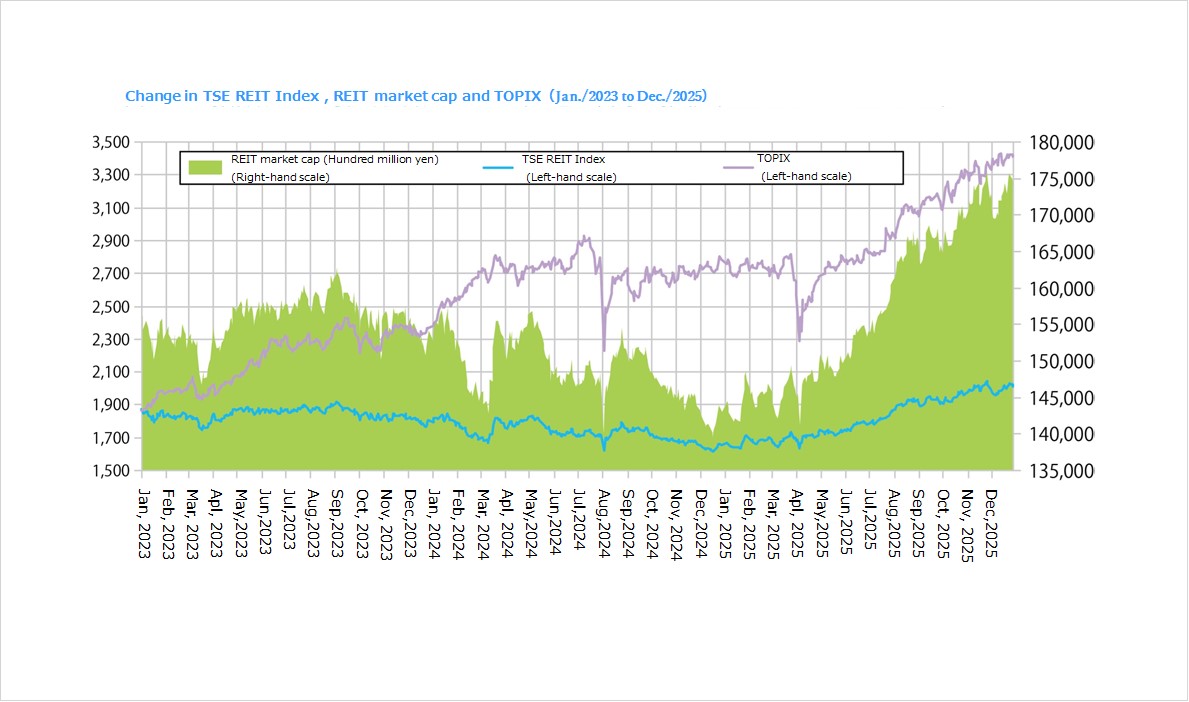
・At the end of December 2025, the TSE REIT index was 2,013.50, up 4.8% from the end of September, and market capitalization of all J-REITs was JPY 17.4222 trillion, up 5.0% from the end of September. Despite a sharp downturn in the second half of November due to concerns about the impact of a decrease in inbound travelers as the Chinese government asked the public to refrain from traveling to Japan, the recovery trend resumed in December because China's impact appears to be limited.
・The aggregate AUM of J-REITs grew by JPY 182.3 billion from the end of September to JPY 24.1330 trillion as of the end of December. While acquisitions of hotel and office properties, for which rents can be expected to increase, have increased, those of healthcare facilities, which have limited room for improvements in earnings, have decreased. Amid rising long-term interest rates, J-REITs are making progress on building inflation-resistant portfolios.
・Backed by the recovery in investment unit market prices, POs resumed for the first time in five months in November 2025. Nippon Hotel & Residential Investment Corporation, United Urban Investment Corporation, and Japan Prime Realty Investment Corporation announced POs as they shift toward phases of external growth by expanding their asset scales.
・No existing REITs have conducted IPOs since that of Nippon Building Fund Inc. in June, and the number of IPOs in 2025 remains at only three. Despite the recovering trend in investment unit market prices, the average NAV ratio (net asset ratio based on current value of real estate) remains less than one. In addition, in the current environment in which it is difficult to secure appropriate yields because of rising real estate prices, REITs are aiming to increase investment unit prices further by increasing capital efficiency through such means as distributing gains from sale of properties and using proceeds from the sale to buy back their own investment units, as well as working to improve their portfolios' earnings and quality through replacement of assets, instead of IPOs.
・The aggregate AUM of J-REITs grew by JPY 123.9 billion from the end of June to JPY 23.9508 trillion as of the end of September 2025. While the numbers of hotel and office properties, for which rents can be expected to increase, have risen, those of logistics facilities and suburban retail facilities, which are comparatively less sensitive to rising rents, have decreased.
・Backed by the recovery in investment unit market prices and favorable hotel market conditions, Kasumigaseki Hotel REIT Investment Corporation conducted its IPO in August, the first new IPO since 2021, four years ago.
■Future market outlook
・Since the rate of growth in market rents on office buildings in central Tokyo is increasing further, internal growth can be expected from higher rents. While interest rate costs increase, the market can be expected to enter a balanced growth cycle of external and internal growth.
・There is also an apparent trend toward the participation of new sponsors in REITs. Meitetsu City Design Co., Ltd., has joined Xymax REIT as a sponsor, leading to its being renamed Central REIT Investment Corporation under its new double-sponsor organization. Other moves to expand external growth opportunities include the participation in Healthcare & Medical Investment Corporation of Tokyu Land Corporation and Keihanshin Building Co., Ltd., and that of Toyota Housing Corporation in Tokaido REIT, Inc. Factors behind the recovery in investment unit market prices include increased returns to investors because REITs have switched to investments with a focus on capital efficiency, further strengthening the upward trends in office and residential rents, a sharp increase in variable rents on hotels backed by growing inbound demand, and continued growth in dividends.


お問い合わせ Contact us
まずは、お気軽にご相談ください。